Using Tasmota Smart Plugs with Telegraf
Graphing my smart home is a long standing hobby of mine. When it comes to smart plugs, I was previously using the Etekcity VeSync outlets and writing metrics to Influx using my own custom Python scripts. I’ve grown less fond of these over time and went looking for a more open solution.
It turns out there are a lot of IoT devices running an open source firmware called Tasmota, which can push metrics to an MQTT broker. My time series database of choice is InfluxDB, and its metrics agent Telegraf comes with an MQTT plugin out of the box.
My demonstration uses the CloudFree Smart Plug 2. This isn’t a sponsored post, I found this device searching online when I was bored.
You’ll need a Linux server capable of running 3 daemons, a Raspberry Pi may suffice:
- Telegraf
- A time series database, recommended: InfluxDB 2.0
- An MQTT broker, recommended: Mosquitto
Time Series Database Setup
If you don’t already have a datastore that Telegraf has an output plugin for, I recommend clicking the InfluxDB link above and following the guide to get setup with it. I’ll consider that outside the scope of this article.
If you want to use a different supported datastore such as Graphite, Prometheus or Elasticsearch, check Telegraf’s output plugin documentation.
MQTT Broker Setup
If you don’t already have an MQTT broker setup (if you’re here this might be your first use case), get Mosquitto setup. Here’s a short version if you’re running Ubuntu or Debian:
# apt install mosquitto
# systemctl stop mosquitto
Add these lines to /etc/mosquitto/mosquitto.conf
listener 1883
protocol mqtt
allow_anonymous true
Make sure the mqtt server is responding:
# systemctl start mosquitto
# curl mqtt://localhost/
curl: (3) Error: No topic specified.
This will be fine for initial troubleshooting provided the broker is on your local network without this port exposed. You should still secure it though. Vultr has a how-to guide on a new Mosquitto installation that is more verbose than this.
Configuring Your Plug
Okay, unpack your plug and follow the instructions for intial setup. Once you have it online, you should have access to the barebones web portal.
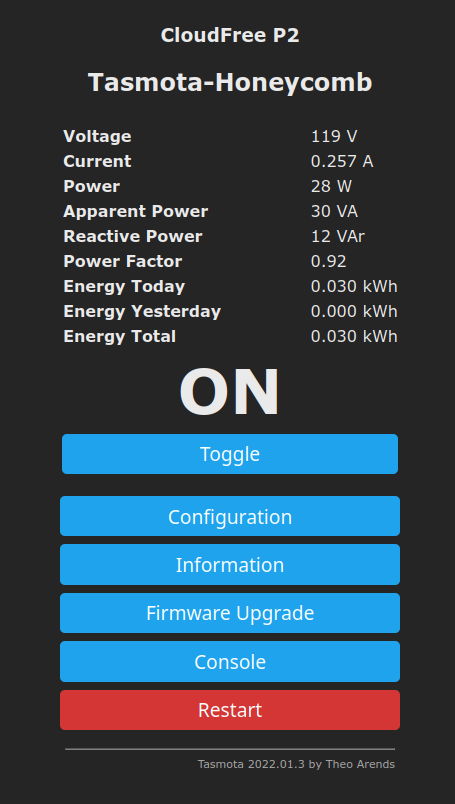
Okay, first go to Configuration so we can cover some bases.
Go to Configure MQTT. Change Host() to the IP address of your MQTT broker, add a User/Password if you configured one, and consider changing the topic to describe this device better than its device ID (tasmota_livingroomtv for example).
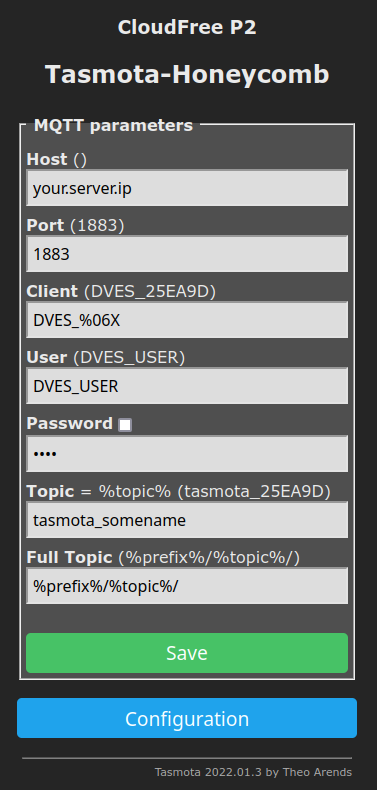
Save your configuration, go back to Main Menu and select Console. There is other business to attend to here.
Enter Time into the command box to get the current time. Is it up to date? Then NTP is working. Is it 1970? Uh oh. Then do this:
NtpServer1 time1.google.com
NtpServer2 time2.google.com
NtpServer3 time3.google.com
Time 0
Timezone 0
Restart 1
Note that I made the timezone of the device UTC with Time 0. If you want to tune this for local time, follow the TimeDst and TimeStd instructions here.
If we did everything correctly, you should now see your smart plug sending messages to your MQTT broker.
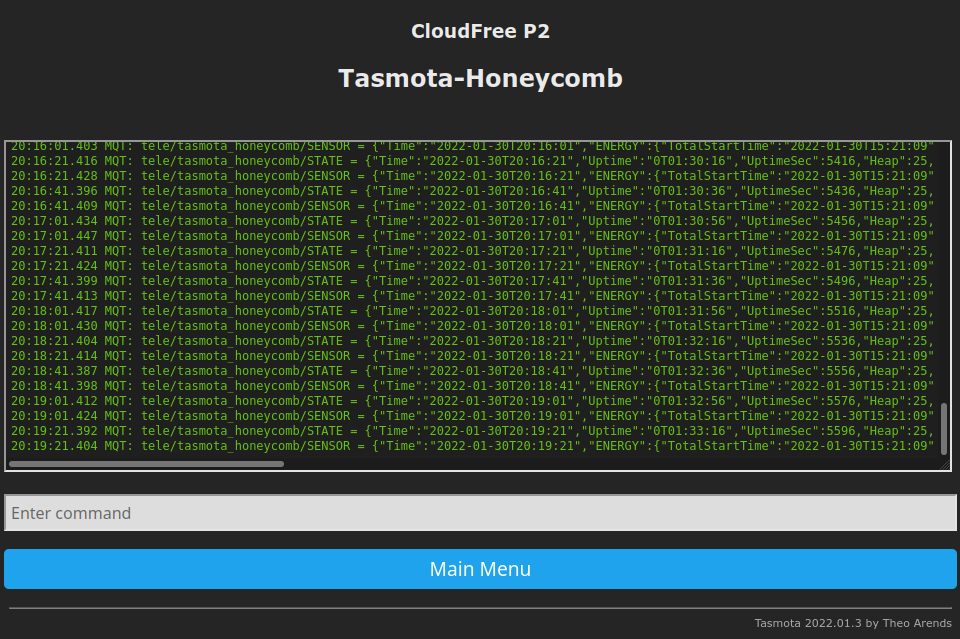
In my example, you can see it updating every 20 seconds. By default, it updates every 3 minutes. Telegraf by default ships every 10 seconds. You should change this to post as often as Telegraf does. If going with the default of 10 seconds, just execute this in the console:
TelePeriod 10
Configuring Telegraf
If this is your first time using Telegraf, I recommend getting setup with the Influx repo and maintaining with your package manager (instructions here). Okay, we’ll need to edit /etc/telegraf/telegraf.conf.
First, configure your output plugin. If you used my recommendation, the plugin is [[outputs.influxdb_v2]], just edit the template with your bucket and other details. The comments on whatever other plugin you may need to use should be verbose.
Next we have to explain to Telegraf where the MQTT lives and how to parse the JSON data it contains. First, look at the console log and copy everything up through SENSOR. In the screenshot above, mine is tele/tasmota_honeycomb/SENSOR because that’s what I named my topic in the config.
Scroll to [[inputs.mqtt_consumer]] in telegraf.conf and make it conform to this:
[[inputs.mqtt_consumer]]
  # The IP address of your MQTT broker.
  servers = ["tcp://127.0.0.1:1883"]
  # topics should include the topic we just discussed for
  # each outlet you're monitoring.
  topics = [
    "tele/tasmota_honeycomb/SENSOR",
  ]

  data_format = "json_v2"
  [[inputs.mqtt_consumer.json_v2]]
    # If you're not using UTC, leave out the two timestamp
    # lines and see if it works. Otherwise, you'll have
    # metrics in the past/future.
    timestamp_path = "Time"
    timestamp_format = "2006-01-02T15:04:05"
    [[inputs.mqtt_consumer.json_v2.object]]
      path = "ENERGY"
If you want to understand what you’re looking at here, you actually have 2 different concepts to read about, mqtt_consumer and JSON v2 input data format. The timestamp code tells it to use the timestamps that Tasmota is providing rather than current time using Go syntax, but since there’s no offset in that string, this will break if you’re using localtime, so omit those two lines.
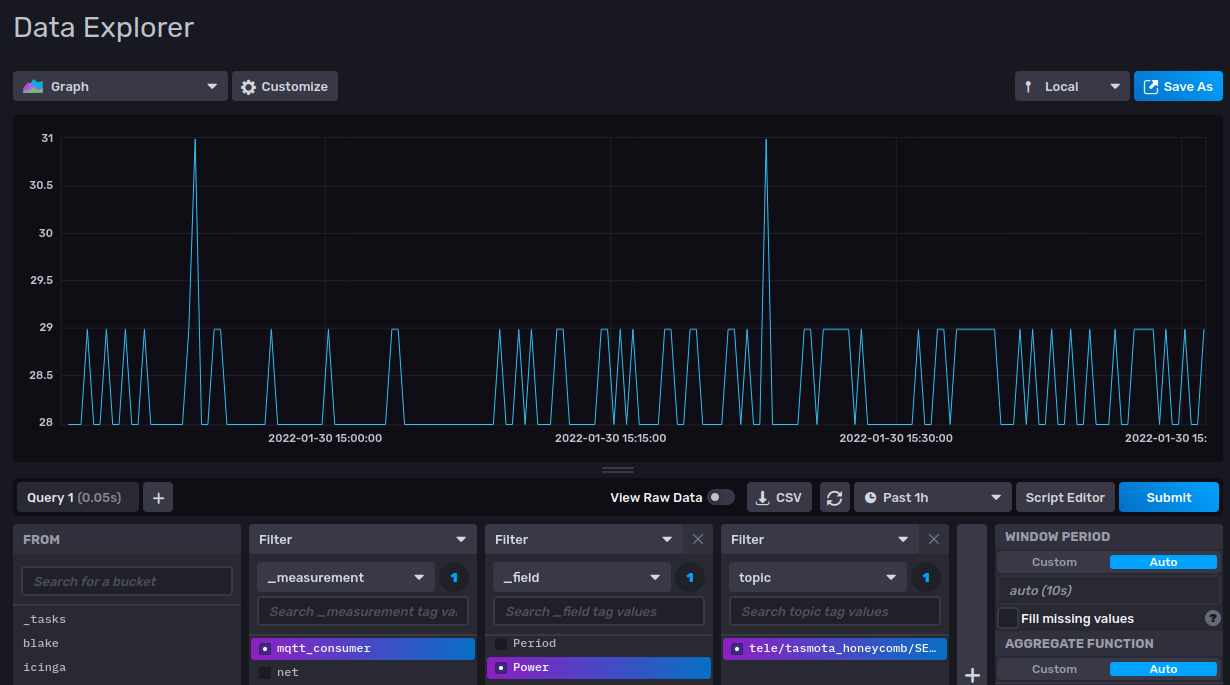
Query Some Data

If all has gone well, you should be able to get historical data about your outlet. In this case, we’re looking at the power usage of my home server and how efficient ARM is.